Highlights
- Install: R and RStudio
- Install and load packages: sf
- Import files: a csv and a spatial data file (GPKG)
R is an open-source statistical programming language used in statistical analysis but also in spatial analysis, artificial intelligence (AI), and machine learning (ML) applications. When coupled with RStudio, an integrated development environment (IDE) for R, it becomes user-friendly with an interactive interface. In this guide, we will walk you through the initial steps of setting up R and RStudio along with installing essential packages and testing them with spatial data.
1. Installing R, RStudio & Understanding the Interface
Before diving into data mining, you need to set up the programming environment. Start by downloading and installing R from the Comprehensive R Archive Network (CRAN) website (https://cran.r-project.org/). Choose the appropriate version for your operating system and follow the installation instructions. Once R is installed, proceed to install RStudio, which provides a user-friendly interface for R programming. You can download RStudio from the official website (https://www.rstudio.com/products/rstudio/download/) and install it on your system.
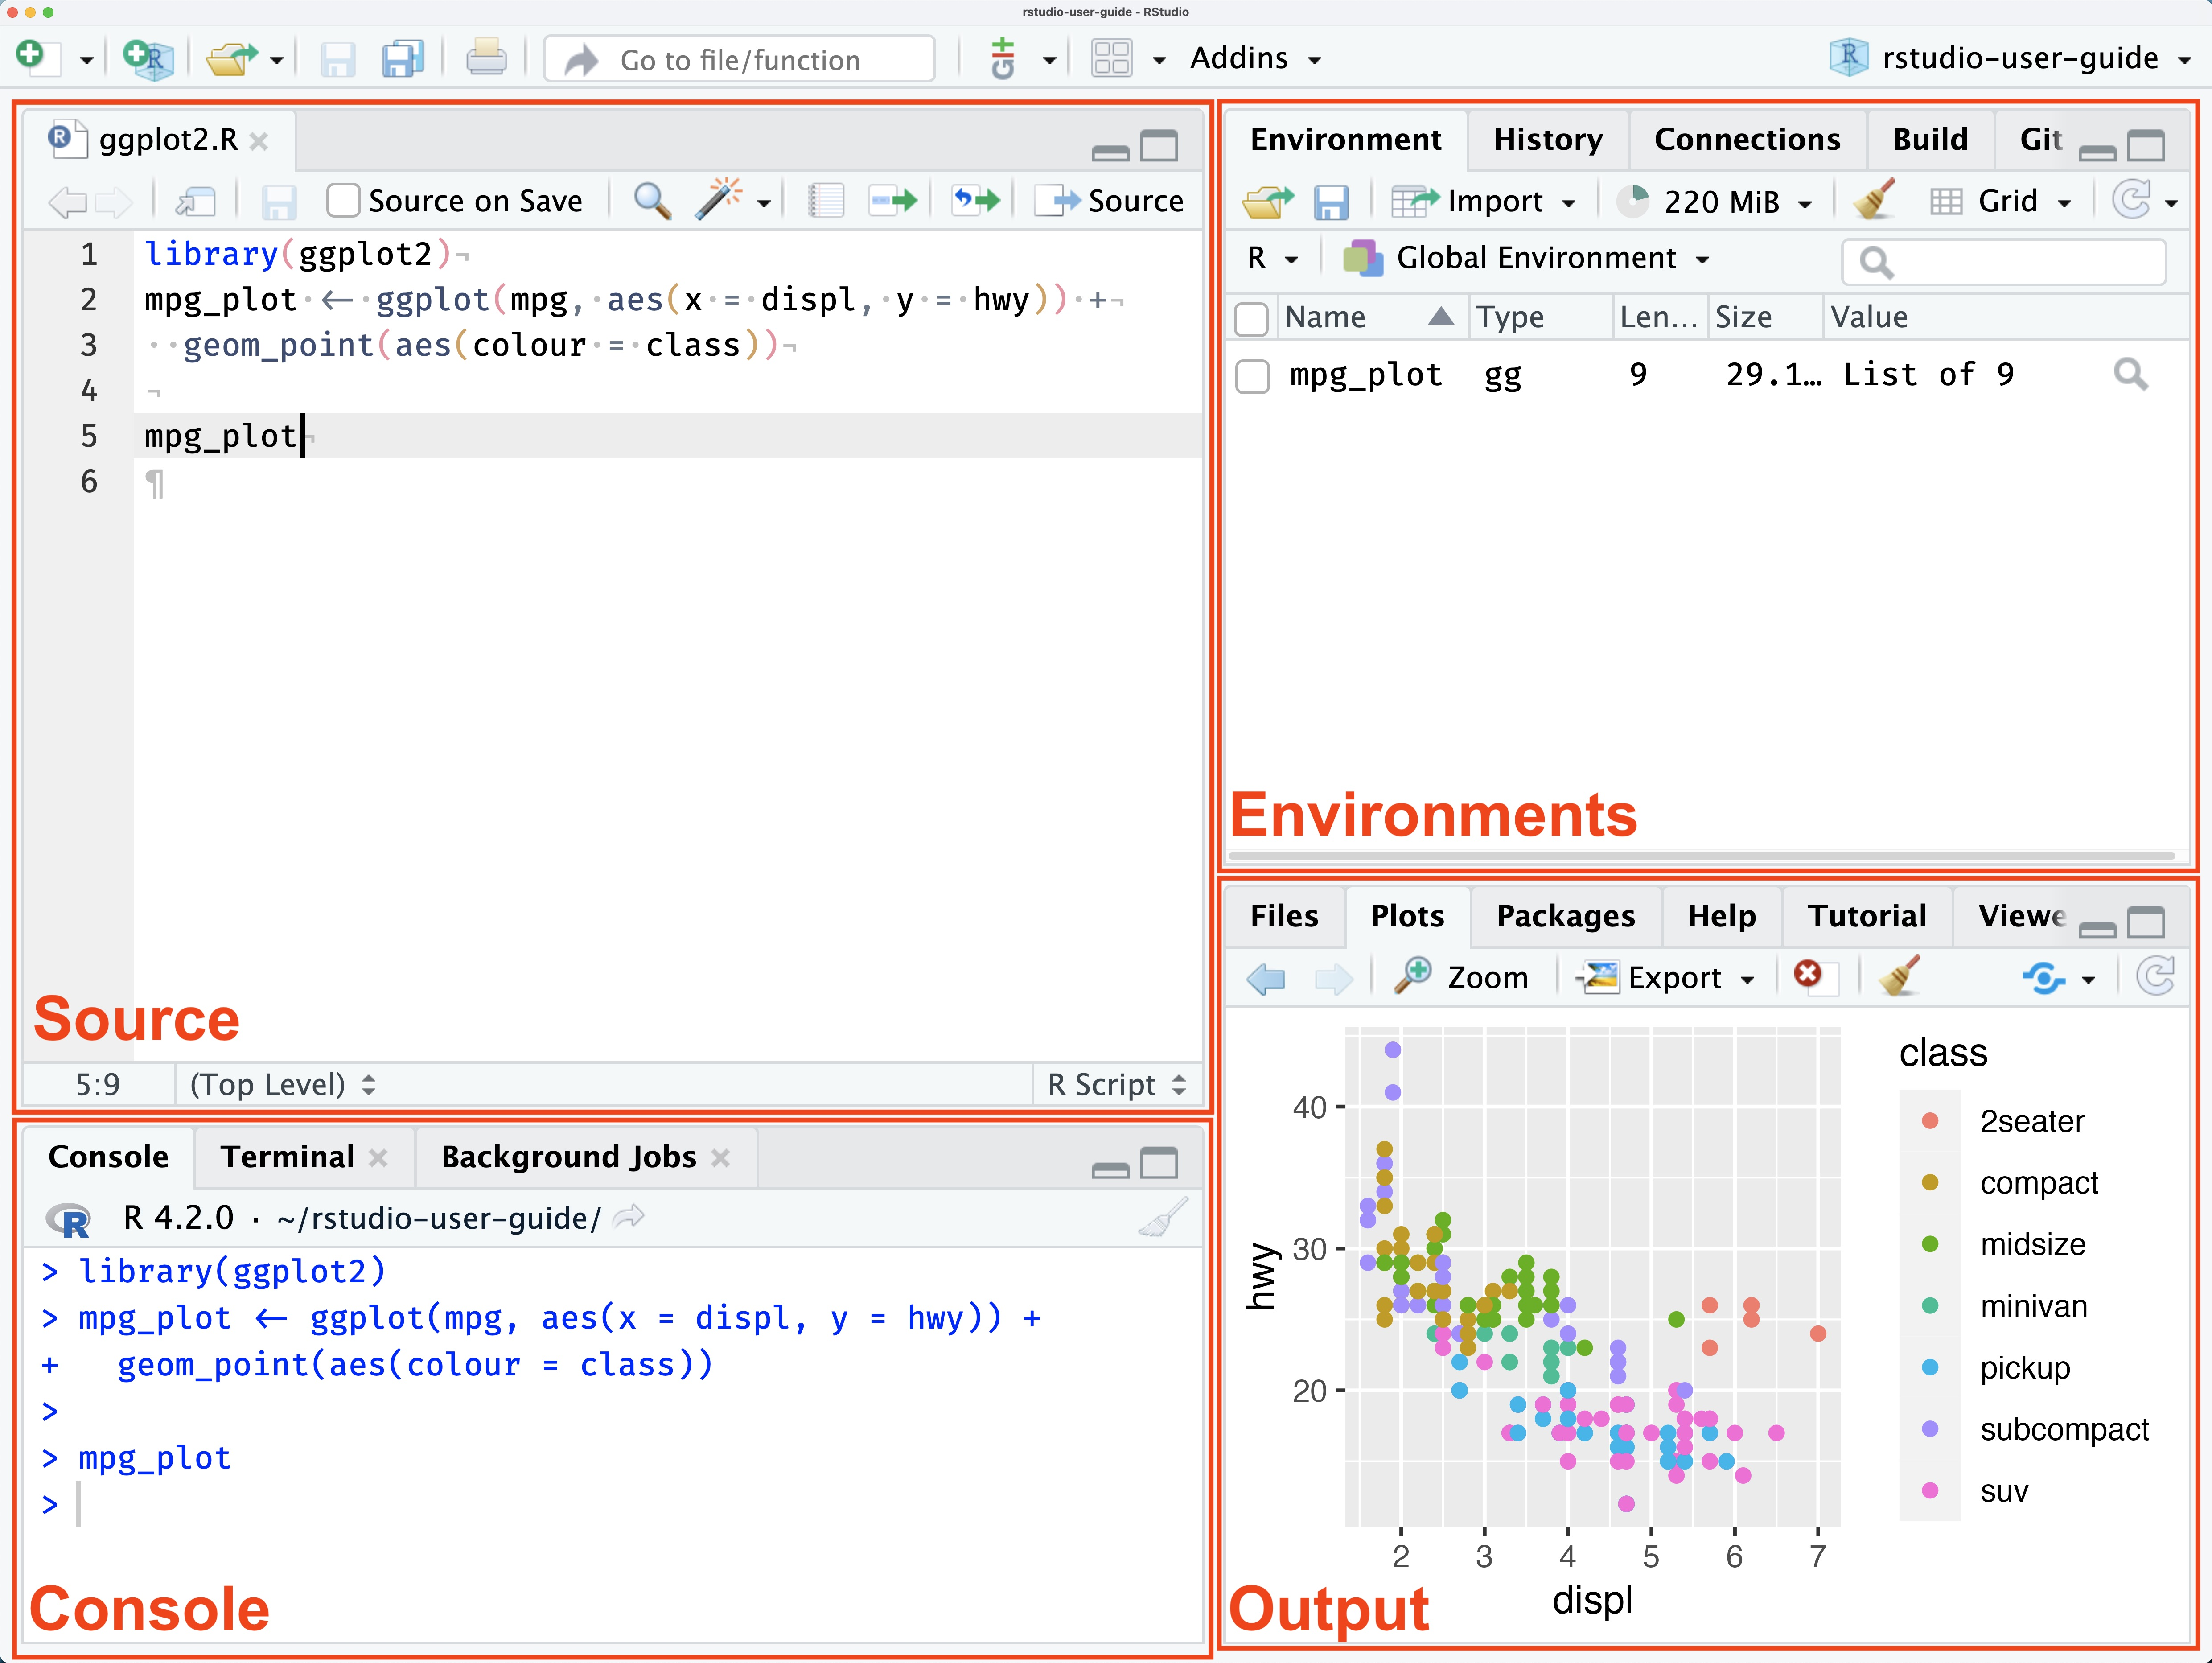
The interface is divided into four parts, each fulfilling a specific role in the workflow. The Source section houses scripts, while the Console executes code and displays feedback. In Environments, users can review imported data and created objects. Finally, the Output section presents graphs, maps, and other outputs. This output section also facilitates file browsing and access to the help sections of the packages.
2. Install and Load Packages into R
R’s functionality can be extended through packages, which are collections of R functions, data, and compiled code. One such essential package for spatial analysis is sf, which provides simple features (sf) for handling and analyzing spatial data. To install the sf package, open RStudio and execute the following command in the console:
install.packages("sf")
Once the sf package is installed, load it into your R session using the library() function:
library(sf)
Now, you have access to a wide range of spatial functions and data structures provided by the sf package, allowing you to manipulate and analyze spatial data efficiently.
3. Importing a csv file into R
Reading a csv file in R is straightforward using the read.csv function. Within this function, you can set a custom delimiter using the sep argument, and point at the presence of a header (first line as column titles). Don’t forget to put your file in your working directory. Alternatively, you can provide the full path to your file if your csv file is not located in your working directory. This website provides samples of csv file to download.
# Example 1: File in the working directory
read_csv = read.csv('file.csv', sep=',', header=FALSE)

# Example 2 : path to file
read_csv = read.csv('/Users/admin/file.csv', sep=',', header=FALSE)
4. Importing spatial data (GPKG) into R
To test the functionality of the sf package, let’s import a GeoPackage (GPKG) layer containing spatial data and visualize it on a map. You can download sample GPKG data from various sources such as governmental GIS portals or open data repositories. Assuming you have a GPKG file named example_data.gpkg, use the st_read() function from the sf package to read the spatial data into R. If you want to know more about the GeoPackage format, and try with a real Geopackage file, you can have a look at this post.
data <- st_read("path/to/example_data.gpkg")
Replace "path/to/example_data.gpkg" with the actual path to your GPKG file. If your geopackage file contains more than one layer, you can choose which layer to import using the layer = "layer_name" argument. Once the data is imported, you can create a simple map to visualize it using the plot() function
plot(data)
This will generate a basic plot displaying the spatial features contained in the GPKG layer.
R combined with RStudio provides a powerful environment for spatial analysis, AI, and ML tasks. By following the steps outlined in this guide, you’ve prepared a perfect environment for exploring more advanced techniques. Stay tuned for more tutorials and insights on leveraging R for spatial analysis. Happy coding
Table of contents

Leave A Comment